
CompositeCurve#
- class rateslib.curves.CompositeCurve(curves, id=NoInput.blank, _no_validation=False)#
Bases:
CurveA dynamic composition of a sequence of other curves.
Note
Can only composite curves of the same type:
CurveorLineCurve. Other curve parameters such asmodifier,calendarandconventionmust also match.- Parameters:
Examples
Composite two
LineCurves. Here, simulating the effect of adding quarter-end turns to a cubic spline interpolator, which is otherwise difficult to mathematically derive.In [1]: from rateslib.curves import LineCurve, CompositeCurve In [2]: line_curve1 = LineCurve( ...: nodes={ ...: dt(2022, 1, 1): 2.5, ...: dt(2023, 1, 1): 3.5, ...: dt(2024, 1, 1): 3.0, ...: }, ...: t=[dt(2022, 1, 1), dt(2022, 1, 1), dt(2022, 1, 1), dt(2022, 1, 1), ...: dt(2023, 1, 1), ...: dt(2024, 1, 1), dt(2024, 1, 1), dt(2024, 1, 1), dt(2024, 1, 1)], ...: ) ...: In [3]: line_curve2 = LineCurve( ...: nodes={ ...: dt(2022, 1, 1): 0, ...: dt(2022, 3, 31): -0.2, ...: dt(2022, 4, 1): 0, ...: dt(2022, 6, 30): -0.2, ...: dt(2022, 7, 1): 0, ...: dt(2022, 9, 30): -0.2, ...: dt(2022, 10, 1): 0, ...: dt(2022, 12, 31): -0.2, ...: dt(2023, 1, 1): 0, ...: dt(2023, 3, 31): -0.2, ...: dt(2023, 4, 1): 0, ...: dt(2023, 6, 30): -0.2, ...: dt(2023, 7, 1): 0, ...: dt(2023, 9, 30): -0.2, ...: }, ...: interpolation="flat_forward", ...: ) ...: In [4]: curve = CompositeCurve([line_curve1, line_curve2]) In [5]: curve.plot("1d") Out[5]: (<Figure size 640x480 with 1 Axes>, <Axes: >, [<matplotlib.lines.Line2D at 0x111d5df90>])
(
Source code,png,hires.png,pdf)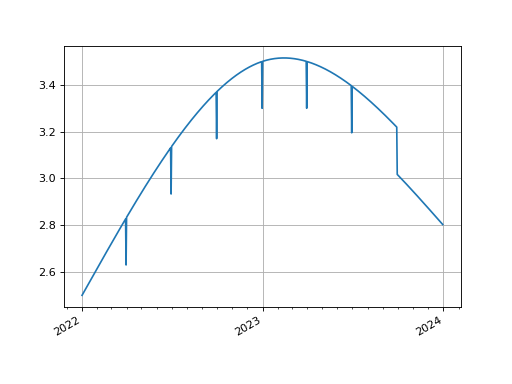
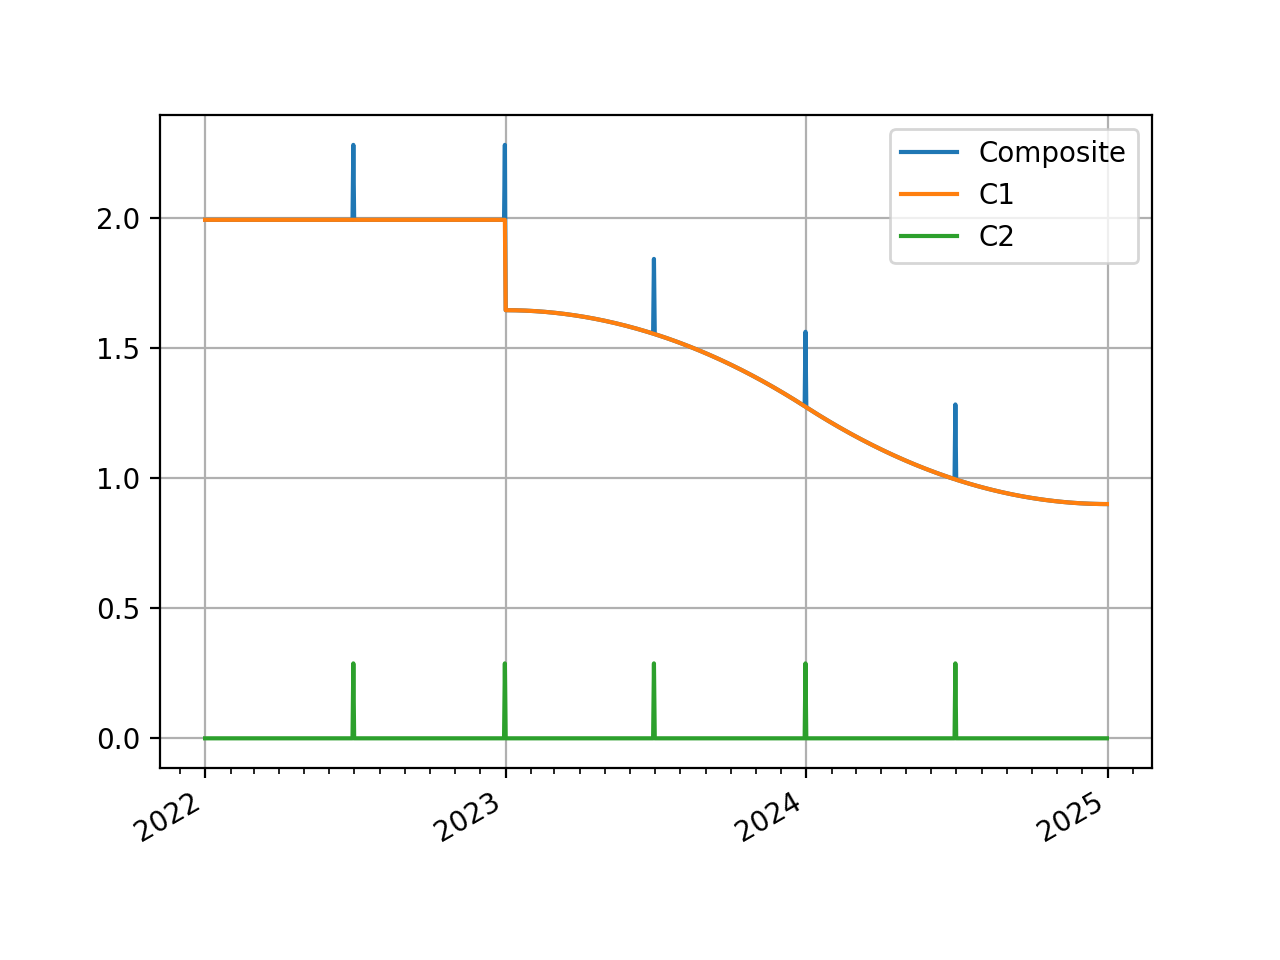
We can also composite DF based curves by using a fast approximation or an exact match.
In [6]: from rateslib.curves import Curve, CompositeCurve

In [7]: curve1 = Curve(
   ...:     nodes={
   ...:         dt(2022, 1, 1): 1.0,
   ...:         dt(2023, 1, 1): 0.98,
   ...:         dt(2024, 1, 1): 0.965,
   ...:         dt(2025, 1, 1): 0.955
   ...:     },
   ...:     t=[dt(2023, 1, 1), dt(2023, 1, 1), dt(2023, 1, 1), dt(2023, 1, 1),
   ...:        dt(2024, 1, 1),
   ...:        dt(2025, 1, 1), dt(2025, 1, 1), dt(2025, 1, 1), dt(2025, 1, 1)],
   ...: )
   ...:

In [8]: curve2 =Curve(
   ...:     nodes={
   ...:         dt(2022, 1, 1): 1.0,
   ...:         dt(2022, 6, 30): 1.0,
   ...:         dt(2022, 7, 1): 0.999992,
   ...:         dt(2022, 12, 31): 0.999992,
   ...:         dt(2023, 1, 1): 0.999984,
   ...:         dt(2023, 6, 30): 0.999984,
   ...:         dt(2023, 7, 1): 0.999976,
   ...:         dt(2023, 12, 31): 0.999976,
   ...:         dt(2024, 1, 1): 0.999968,
   ...:         dt(2024, 6, 30): 0.999968,
   ...:         dt(2024, 7, 1): 0.999960,
   ...:         dt(2025, 1, 1): 0.999960,
   ...:     },
   ...: )
   ...:

In [9]: curve = CompositeCurve([curve1, curve2])

In [10]: curve.plot("1D", comparators=[curve1, curve2], labels=["Composite", "C1", "C2"])
Out[10]:
(<Figure size 640x480 with 1 Axes>,
 <Axes: >,
 [<matplotlib.lines.Line2D at 0x11221f890>,
  <matplotlib.lines.Line2D at 0x11221f9d0>,
  <matplotlib.lines.Line2D at 0x11221fb10>])
(
Source code,png,hires.png,pdf)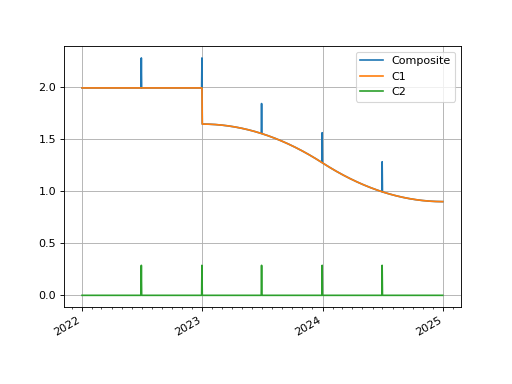
Attributes Summary
Int in {0,1,2} describing the AD order associated with the Curve.
A str identifier to name the Curve used in
Solvermappings.An instance of
_CurveInterpolator.An instance of
_CurveMeta.An instance of
_CurveNodes.Methods Summary
copy(*args, **kwargs)Not implemented on CompositeCurve types.
csolve(*args, **kwargs)Not implemented on CompositeCurve types.
from_json(*args, **kwargs)Not implemented on CompositeCurve types.
index_value(date, index_lag[, interpolation])Calculate the accrued value of the index from the
index_base, which is taken asindex_baseof the first composited curve given.plot(tenor[, right, left, comparators, ...])Plot given forward tenor rates from the curve.
plot_index([right, left, comparators, ...])Plot given index values on a curve.
rate(effective[, termination, modifier])Calculate the composited rate on the curve.
roll(tenor)Create a new curve with its shape translated in time
shift(spread[, id, collateral, composite])Create a new curve by vertically adjusting the curve by a set number of basis points.
to_json(*args, **kwargs)Not implemented on CompositeCurve types.
translate(start[, t])Create a new curve with an initial node date moved forward keeping all else constant.
update(*args, **kwargs)Not implemented on CompositeCurve types.
update_meta(key, value)Not implemented on CompositeCurve types.
update_node(*args, **kwargs)Not implemented on CompositeCurve types.
Attributes Documentation
- ad#
Int in {0,1,2} describing the AD order associated with the Curve.
- interpolator#
An instance of
_CurveInterpolator.
- meta#
An instance of
_CurveMeta.
- nodes#
An instance of
_CurveNodes.
Methods Documentation
- copy(*args, **kwargs)#
Not implemented on CompositeCurve types.
- csolve(*args, **kwargs)#
Not implemented on CompositeCurve types.
- from_json(*args, **kwargs)#
Not implemented on CompositeCurve types.
- index_value(date, index_lag, interpolation='curve')#
Calculate the accrued value of the index from the
index_base, which is taken asindex_baseof the first composited curve given.
- plot(tenor, right=NoInput.blank, left=NoInput.blank, comparators=NoInput.blank, difference=False, labels=NoInput.blank)#
Plot given forward tenor rates from the curve. See notes.
- Parameters:
tenor (str) – The tenor of the forward rates to plot, e.g. “1D”, “3M”.
right (datetime or str, optional) – The right bound of the graph. If given as str should be a tenor format defining a point measured from the initial node date of the curve. Defaults to the final node of the curve minus the
tenor.left (datetime or str, optional) – The left bound of the graph. If given as str should be a tenor format defining a point measured from the initial node date of the curve. Defaults to the initial node of the curve.
comparators (list[Curve]) – A list of curves which to include on the same plot as comparators.
difference (bool) – Whether to plot as comparator minus base curve or outright curve levels in plot. Default is False.
labels (list[str]) – A list of strings associated with the plot and comparators. Must be same length as number of plots.
- Returns:
(fig, ax, line)
- Return type:
Matplotlib.Figure, Matplotplib.Axes, Matplotlib.Lines2D
Notes
This function plots single-period, simple interest curve rates, which are defined as:
\[1 + r d = \frac{v_{start}}{v_{end}}\]where d is the day count fraction determined using the
conventionassociated with the Curve.This function does not plot swap rates, which is impossible since the Curve object contains no information regarding the parameters of the ‘swap’ (e.g. its frequency or its convention etc.). If
tenorslonger than one year are sought results may start to deviate from those one might expect. See Issue 246.
- plot_index(right=NoInput.blank, left=NoInput.blank, comparators=NoInput.blank, difference=False, labels=NoInput.blank, interpolation='curve')#
Plot given index values on a curve.
- Parameters:
tenor (str) – The tenor of the forward rates to plot, e.g. “1D”, “3M”.
right (datetime or str, optional) – The right bound of the graph. If given as str should be a tenor format defining a point measured from the initial node date of the curve. Defaults to the final node of the curve minus the
tenor.left (datetime or str, optional) – The left bound of the graph. If given as str should be a tenor format defining a point measured from the initial node date of the curve. Defaults to the initial node of the curve.
comparators (list[Curve]) – A list of curves which to include on the same plot as comparators.
difference (bool) – Whether to plot as comparator minus base curve or outright curve levels in plot. Default is False.
labels (list[str]) – A list of strings associated with the plot and comparators. Must be same length as number of plots.
interpolation (str in {"curve", "daily", "monthly"}) – The type of index interpolation method to use.
- Returns:
(fig, ax, line)
- Return type:
Matplotlib.Figure, Matplotplib.Axes, Matplotlib.Lines2D
- rate(effective, termination=NoInput.blank, modifier=NoInput.inherit)#
Calculate the composited rate on the curve.
If rates are sought for dates prior to the initial node of the curve None will be returned.
- Parameters:
effective (datetime) – The start date of the period for which to calculate the rate.
termination (datetime or str) – The end date of the period for which to calculate the rate.
modifier (str, optional) – The day rule if determining the termination from tenor. If False is determined from the Curve modifier.
- Return type:
- roll(tenor)#
Create a new curve with its shape translated in time
This curve adjustment is a simulation of a future state of the market where forward rates are assumed to have moved so that the present day’s curve shape is reflected in the future (or the past). This is often used in trade strategy analysis.
- Parameters:
tenor (datetime or str) – The date or tenor by which to roll the curve. If a tenor, as str, will derive the datetime as measured from the initial node date. If supplying a negative tenor, or a past datetime, there is a limit to how far back the curve can be rolled - it will first roll backwards and then attempt to
translate()forward to maintain the initial node date.- Return type:
- shift(spread, id=NoInput.blank, collateral=NoInput.blank, composite=True)#
Create a new curve by vertically adjusting the curve by a set number of basis points.
See
Curve.shift()
- to_json(*args, **kwargs)#
Not implemented on CompositeCurve types.
- translate(start, t=False)#
Create a new curve with an initial node date moved forward keeping all else constant.
This curve adjustment preserves forward curve expectations as time evolves. This method is suitable as a way to create a subsequent opening curve from a previous day’s closing curve.
- Parameters:
start (datetime) – The new initial node date for the curve, must be in the domain: (node_date[0], node_date[1]]
t (bool) – Set to True if the initial knots of the knot sequence should be translated forward.
- Return type:
- update(*args, **kwargs)#
Not implemented on CompositeCurve types.
- update_meta(key, value)#
Not implemented on CompositeCurve types.
- update_node(*args, **kwargs)#
Not implemented on CompositeCurve types.